The Budget sheet is an easy way to do analyses of your forecast compared to your actual results. Prebuilt into the Starter, Standard, and all Standard model variants, the Budget sheet was introduced to prebuild an analysis that had always been a custom addition; if you are using the model to include your historical financials, then the budget variances will automatically appear as you start to link in your actual results into the Forecast sheet.
More about how to pull in your actual financials from Quickbooks, Xero, or any accounting software and create rolling forecasts at Actual Financials →
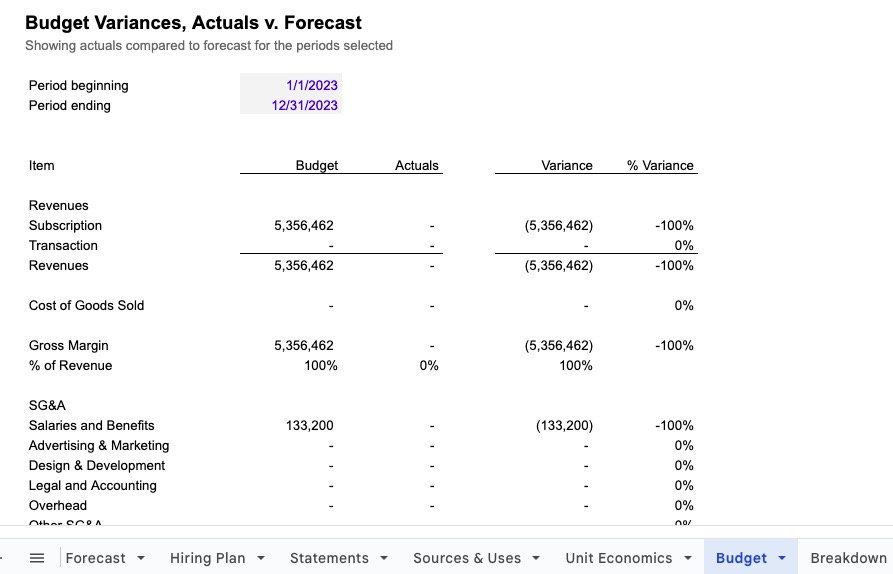
How to use
The key in using this sheet is mapping the revenues and expenses in the forecast section to a set of categories that are mapped to a similar set of revenues and expenses from the chart of accounts from your export of accounting financials. Rarely do the lines used to create a forecast match the lines used to track the actual results, so mapping them to similar categories is important for making the analysis useful.
How it works
The sheet uses the actuals and the forecast directly from the categories on Forecast. If you input actual financial results by linking into the Actuals section on Forecast, the model will automatically update the financials used in Statements, Key Reports, Summary, Breakdown, and all reports, but since the model will still keep the forecast in the forecasted revenues and expenses on Forecast, it can then pull in the forecast to compare to the actuals.
The sheet will display the budget (or forecast), actuals, variance, and % variance in their own columns. The analysis is done covering one period, defined by the dates input into the sheet. The model will only draw in the forecast that covers the same period represented in the actuals; meaning, if you've pulled in Jan and Feb of 2020, the model will display the forecast for Jan-Feb 2020. This is done so the comparisons are on the same base.
Inputs
At the top of the sheet are inputs for two dates, these define the start and end of the period used to create the Budget sheet.
Common Modifications
The sheet is not commonly edited unless the revenue and expense categories used on Forecast were expanded or contracted, in which case editing this sheet is required for it to display the correct information.
- One common modification is to edit the revenue and expense categories displayed on the sheet to match any changes in the number of categories made on the
Forecastsheet. Changing the category names will not matter, they willupdate automatically, but if you create new categories or delete categories and insert or delete rows, you will have to edit this sheet to match. Simply insert rows in the category section to match the relative category rows on Forecast, select the row above or below the empty rows, and copy the formula into the blank rows, and all formulas will adjust automatically. Check the categories to confirm that they match the categories and the order used on theForecastsheet. - A second common modification is to replicate the analysis to cover additional periods. You can duplicate the sheet and change the dates, or copy the columns and paste to the right, and then change the dates, and repeat the same steps to create as many different analyses as desired.
This sheet can be hidden or deleted with no impact on the rest of the model, as no results here are used elsewhere in the model.
Questions, contact me.