
Here is today's test of an AI modeling tool:
Build a 10-year cash flow forecast for a venture capital fund, including standard VC performance metrics (IRR, TVPI, DPI, RVPI, J-curve visualization, capital calls, distributions, NAV, etc.)
The idea is to see what today's AI tools can create, attempting to build something like Foresight's Venture Capital Model, Annual Forecast model, a fairly stripped down approach to building a simple fund forecast. For this example I used Shortcut, an Excel AI agent and spreadsheet modeling tool. Shortcut has raised over $30 million in venture capital, aiming to do more than Microsoft's Agent Mode and general LLMs in building a tool to help people create financial models and analyses.
After some questions and modifications to the prompt to build out more details, agree on the sheet structure, assumptions layout, and implementation plan, Shortcut got to work. And the first draft looked solid. But as I started looking into the details, I started running into issues, both in terms of model structure and business logic.
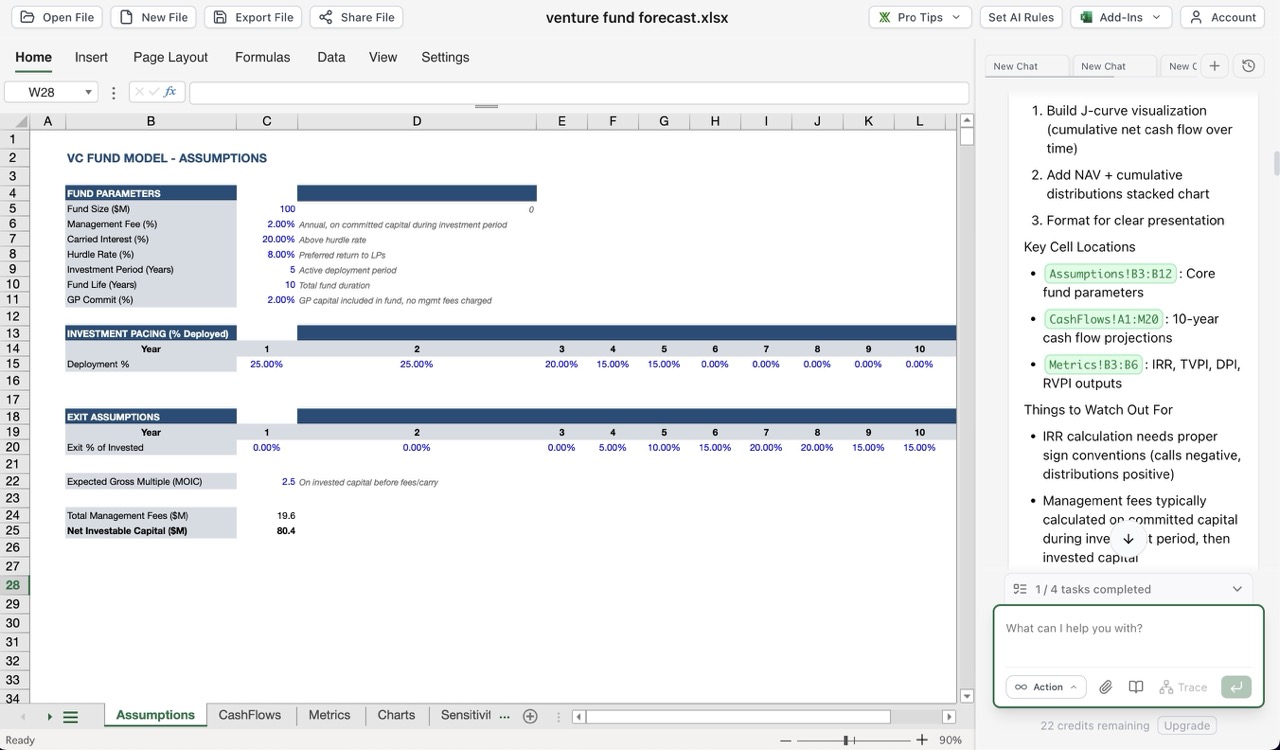
Overall, the structure we settled on makes sense. A sheet for assumptions, a sheet for annual cash flows, a sheet for metrics reporting, and a sheet for charts. Curiously, the first version of the model created the cash flow forecast using hard-coded numbers instead of linking to the assumptions, but that was easy for Shortcut to fix once I pointed it out. The basic structure for fund parameters, investment pacing and exit assumptions makes sense, and the first draft of the fund cash flows covered the basics.
The issues came once I started digging into the model and auditing the results.
- Called capital was greater than total fund size because the model assumed that invested capital was equal to the fund size, and added management fees on top of that. In addition, it took management fees in year 0 before the fund had called any capital. Not too hard to fix once I pointed out the errors, took a couple prompts but that got fixed.
- TVPI (total value to paid-in capital) was greater than the gross exit multiple assumption, a foundational business logic error. TVPI is a net metric, meaning it will reflect performace on paid-in capital after fees, and will be thus be lower than the gross multiple, which reflects the performance on invested capital before the impact of fees (including management fees, fund operating expenses, carried interest). This one took a bit longer to fix, because (a) I had to remove the residual value that led to RVPI > 0 at fund exit (another logic error), thus inflating TVPI, which proved harder for Shortcut to fix because it didn't understand the source of unrealized gains and how to model the increases and decreases of them, and (b) fixing it exposed a model structure flaw in how it calculated gross proceeds from the invested capital (the calculated gross proceeds didn't result in the assumed gross exit multiple, meaning the model was not internally consistent). Even after multiple corrections, the logic for calculated unrealized gains was incorrect, resulting in inflated net asset value (NAV) in the early years and a mistaken J Curve. This one would be harder for a less-experienced modeler or fund manager to catch, but very important to get right.
- The waterfall calcs were incorrect. Fund waterfalls can be difficult to understand, and I've seen this one in many fund manager-created models (including a few AI-generated models managers have sent me), so I wasn't surprised by this. But again, unless you know how a waterfall should work and know how to apply it, this would be easy to miss. By default Shortcut built in a hurdle rate, which would not be the default assumption for US venture funds (but could be for other types of funds), and calculated the carried interest as a simple percentage of gross proceeds, without accounting for the return of capital. Once we fixed that, there was a misunderstanding of what waterfall approach for Shortcut to use. Fixing that one required a bit of explaining, but Shortcut was able to build a European waterfall pretty easily after that. I have a hunch an American waterfall would have been more challenging.
- The concept of a GP commit was incorrectly applied. I didn't include a GP commit, or the capital that a general partner (GP) has to invest in the fund along side limited partners (LP), in the initial prompt, but once I attempted to add it in, it took a few prompts to get management fees, proceeds, and cash flows adjusted correctly. Easy if you know what to look for, hard if you are not familiar with the implications of the GP commit.
- The Sensitivity table approach was at first practical but not obvious, then after attempting to fix it fundamentally flawed. This one is harder, and perhaps a bit more subjective, though. We only created sensitivity tables because Shortcut suggested it, and I agreed even though I knew tables like that are difficult to do in spreadsheets. Shortcut's first output was a table of fund metrics (IRR and TVPI) by Gross Exit Multiple, a table of IRR by gross exit multiple and exit timing, and a table of TVPI by gross exit multiple and timing. The issue is that the first output was entirely hard-coded, or to be more specific, I am assuming it was created by Shortcut by running the model for each combination of variables and outputing the value into the table. Here's the catch: if you change any of the assumptions, then the table is entirely wrong and needs to be regenerated. But that's an issue common to spreadsheet users, and one that can really only be solved with Excel's Data Table option, which takes careful structural thinking for an Excel user to implement. Shortcut doesn't support Data Tables at the moment, so after I chatted with Shortcut about options it created formula-based sensitivites by scaling the calcs, which sounds good but is a flawed approach as well. At the end of the day using Shortcut to generate the tables "manually" is likely the best approach, as it's far quicker to prompt an AI tool to create the table than for the modeler to generate it manually themselves. But again, if you didn't know that the table was created statically, you might not know you need to regerate it each time you changed anything in the model assumptions or structure.
- The charts did not provide the right insights. Shortcut and I agreed to two charts: one a J curve showing fund performance over time, and the second a chart of NAV compared to cumulative distributions. Shortcut created a J curve chart using cumulative net cash flows instead of IRR, which would be the J curve chart that users would be expecting, but the shape was correct. The NAV and cumulative distributions chart was close, but the use of a stacked chart created the wrong insights about cumulative distributions.
Overall I still think Shortcut did fairly well, and if I gave it a 50-60 out of 100 grade, that would be on par with expectations for most human modelers. Do not interpret this as a takedown of Shortcut, or a negative outlook on AI modeling tools; I am impressed with what it was able to create from a fairly simple prompt and an hour of guidance. While I am pointing out above what it got wrong, I could write just as much about what it got right with barely any guidance from me: multiple-sheet structure, primary fund assumptions, layout and the initial assumptions for investment deployment and gross proceeds, IRR calculations, and much more. There's a lot to like.
My warning is aimed at users: as we build AI into financial tools, it is important that we are able to analyze the outputs with a critical eye to the structure, calculations, and outputs. You still have to know the business well enough to interpret the model and catch potential errors. Just like my tests in using AI to build cap tables, you cannot simply trust the outputs, and it will take some fundamental knowledge outside of the LLM or modeling tool for you to be able to use AI to create models or analyze financial data. [1]
I think the challenge here is that it's a bit different than coding, as financial modeling lacks the same generally understood and documented languages, frameworks, and tools as coding, and requires more fundamental and specific business knowledge that is less structured and documented. I love work like the Financial Modeling Handbook and FAST because they work to build and communicate general approaches and standards for model building, providing the educational base to help people build better models. AI will get better, but there is still ample room today for modelers to use domain expertise and spreadsheet ability to improve on the outputs of AI finance tools.
As an example, I have had a number of users send me models that they created first from AI with requests for what they expected to be minor edits, only to have me point out fundamental flaws in the model logic that they had not caught or properly understood. The experiences have made me question everything I use AI to help create; if I'm not the subject matter expert in what AI creates, how do I know if it's right or wrong? ↩︎