
Originally written for OpenVC, How to Model a Venture Capital Fund
As a prospective or emerging fund manager, you will spend most of your time crafting your investment thesis, and detailing how and why founders and investors should work with you, towards creating a point of view on how you will create a successful venture fund.
Creating a financial model for your fund allows you to detail your thesis and strategy in quantitative terms, to create some expectations for how you will spend your investors’ capital and generate returns on your investments.
While creating a financial model for a venture capital fund is difficult, given the speculative nature of forecasting investment results, the act of creating a forecast is still valuable, as it allows you to:
- Outline to potential limited partners the fund’s expenses, your fees for operating the fund, and their expected capital calls
- Reflect your investment strategy, primarily in terms of check sizes, follow on reserves, and investment deployment timelines, and make sure that your strategy reflects reasonable benchmarks and expectations
- Create a forecast of capital reserves and operating budgets so you can plan capital deployment, hiring, and operational strategies
- Demonstrate to potential limited partners that you have a solid plan on how to deploy capital towards your investment thesis
- Create a point of view on how your thesis aligns with typical investments in your industry, and create a grounded range of expectations of how those investments will generate returns
As the founder of Foresight, and an ex-venture capitalist, I’ve worked with over six hundred emerging and prospective venture fund managers creating financial models for portfolio construction and operating cash flows for their first funds. I’ve worked with managers that have raised hundreds of millions of dollars from limited partners around the world, mentored at accelerators for prospective fund managers, and worked directly with angel investors and venture capitalists analyzing their investment portfolios and potential returns.
My goal from this post is for you to come away with a solid idea of what it means to create a financial model for a venture capital fund, the various ways you can create a portfolio construction and operating cash flow model, and provide you with templates and examples that you can use for modeling your fund.
Before you get started
Modeling a venture fund typically consists of two models:
- A model for the fund, the entity making the investments
- A model for the management company, the entity managing the fund (or multiple funds)
Modeling the management company is similar to modeling any operating company, and typically consists of modeling revenues - primarily management fees from the fund(s) - and expenses - salaries, overhead, legal, accounting, travel, etc. - to create a forecast of cash flows and financials.
This post will focus on creating a model for a fund, not for the management company. Budgeting the Management Company of a Venture Capital Fund covers modeling a management company in detail.
Modeling a venture fund can vary from modeling other types of private equity investments. Private equity funds and real estate investment funds often have fund structures and expectations in how and when proceeds are received that differ substantially from venture capital funds. Similarly, hedge funds have different structures and expectations around investment and limited partner liquidity, making them substantially different from venture funds. Open-ended venture funds, evergreen funds, venture debt, revenue-sharing venture funds, and fund of funds share many similarities regarding capital budgeting and deployment, but often differ in the timing and nature of proceeds and recycling. For this post, we will focus on closed-ended venture funds making investments into equity or equity-like structures (convertible notes, SAFEs, SAFTs, and other token structures).
Contact me if you have questions on modeling alternative venture structures.
The best models for venture funds are built with the intent of reflecting their investment strategies. Extreme outcomes from a small number of investments usually drive overall portfolio returns, and the resulting power laws make it difficult to create deterministic forecasts of when and how these extreme outcomes will happen. I focus on creating models that help managers understand their strategies, using their expectations of their investment thesis to understand if their strategies “work” based on their assumptions.
Tools to build a model
Spreadsheets - primarily Microsoft Excel and Google Sheets - are the most common tools used to build financial models for venture capital funds, because of the accessibility and familiarity that most emerging managers have with the tools. Many modelers will use add-ins to assist with scenario modeling to help understand the impact of variability in their assumptions, and a number of tools for Monte Carlo and scenario analysis are readily available to help understand portfolio construction assumptions and ranges of expected returns.
A few pre-built templates in Excel or Google Sheets include:
- Portfolio Construction for Dummies, by Hadley Harris (Eniac Ventures), free
- Open Source Venture Model (V1), by Sam Gerstenzang, free
- Airstream Alpha Fund Financial Budget Template, free
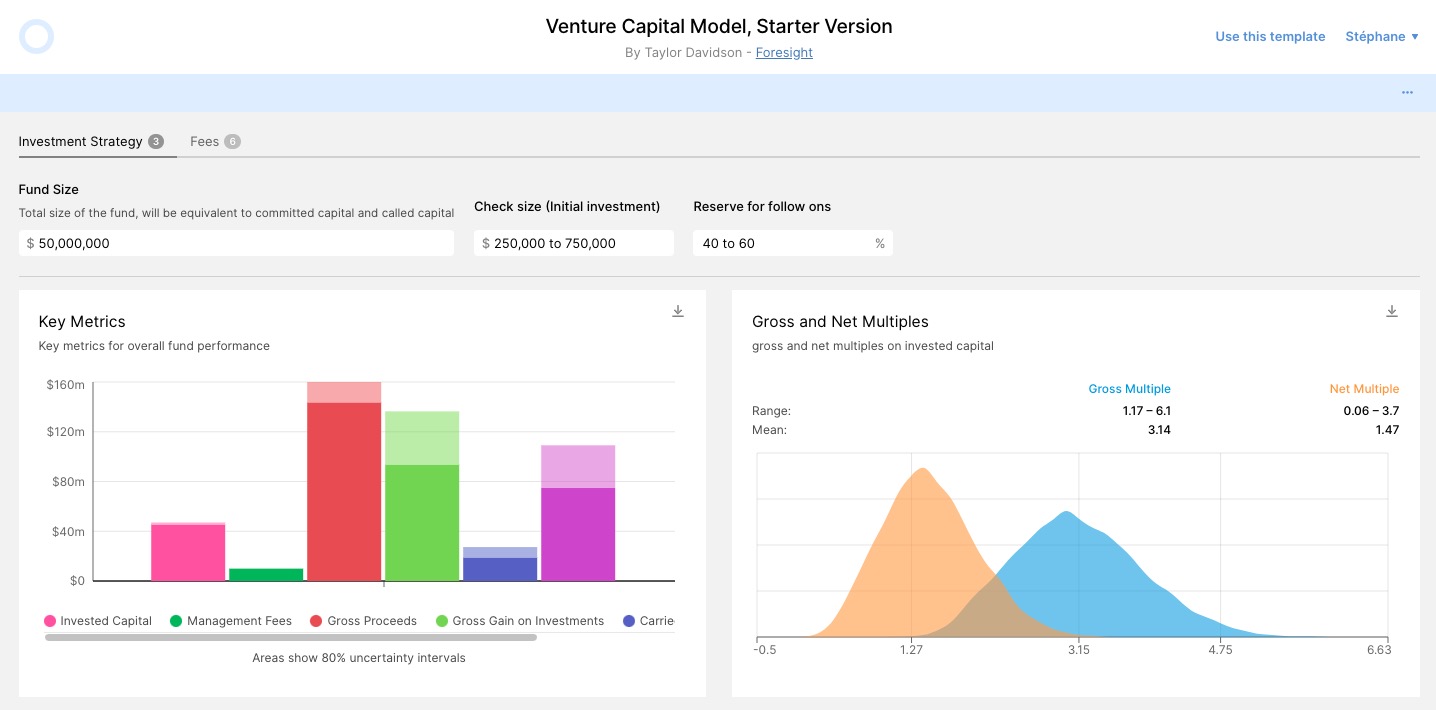
- Venture Capital Model (Annual Forecast), by Foresight, free
- Venture Capital Model (Quarterly Forecast), by Foresight, paid
Causal is a good web-based tool for building models, particularly for people familiar with the spreadsheet user experience, but want to take advantage of prebuilt functionality to do range-based inputs, scenario analysis, and probability-based distribution of returns analysis. A model in Causal can completely replace an Excel or Google Sheets model, and is easy to use as an analysis tool for yourself and potential limited partners in your fund.
Two prebuilt templates on Causal to review include:
- Venture Fund Model, by Craig Thomas
- Venture Capital Model, by Taylor Davidson
Tactyc Venture Manager is a platform for fund managers to create and manage venture portfolios, which includes a range of features to help fund managers understand portfolio construction and fund management.
The 10 components to building a venture fund model
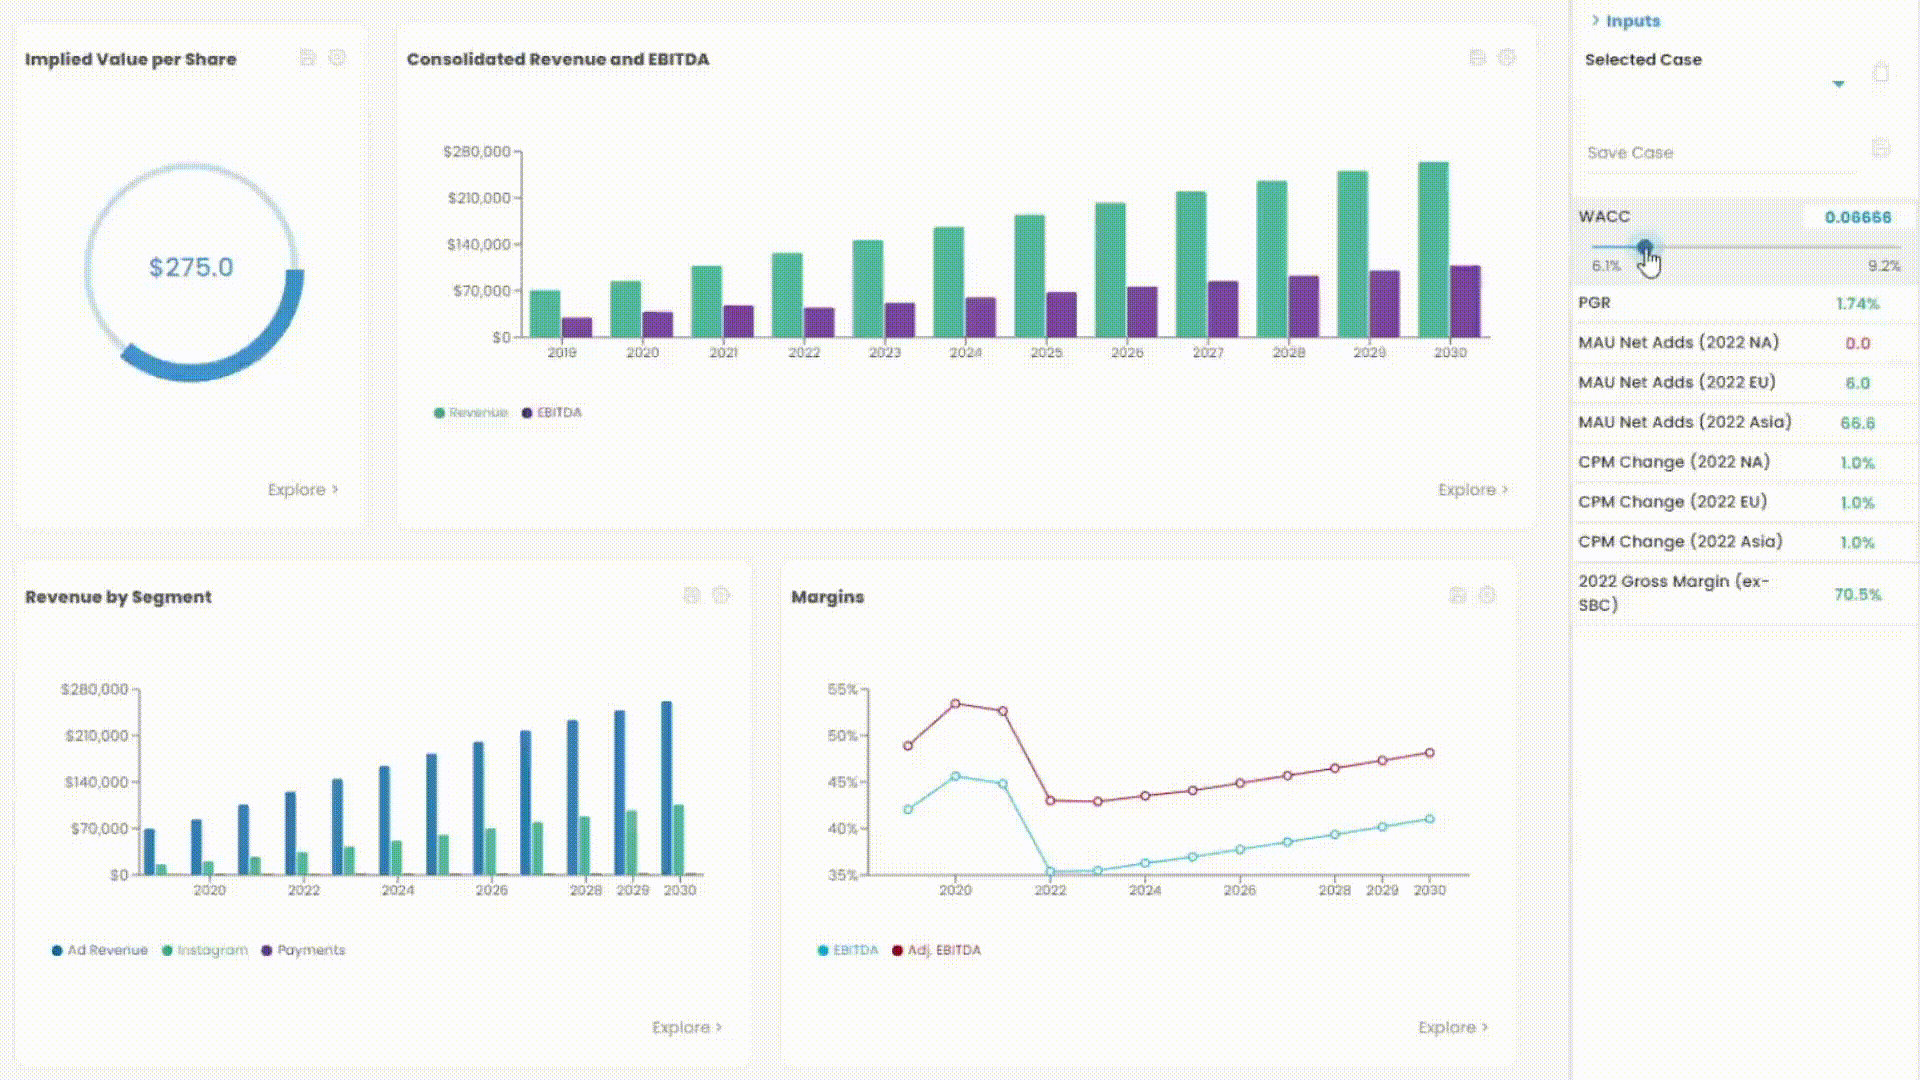
The first consideration in building a model for a fund is whether you want to model the overall fund, or whether you want to add on modeling the cash flows over time. Modeling the total fund investments and returns, without considerations for when those investments and returns happen, is a simple exercise and can be useful for basic understanding of fund strategy. Adding the notion of timing of when significant events in your portfolio happen - write-offs, unrealized gains from markups in investments, proceeds from exits - adds in richer detail to understand the cash flows over time and develop an appreciation for the key metrics that managers are judged on.
For your first attempt at building a model, start simple by modeling the total fund investments and returns, which would likely be a one or two sheet model. As you develop your competence in modeling and understanding of venture economics, add in more complexity and detail to your model. When it comes time to start making investments, you will want to have a model that captures cash flows over time so that you can properly budget and plan for your investments, reserve capital for follow-ons if that is part of your strategy, and start to plan for the future of your fund. While a fund model may not be the central focus of your fundraising process, it will typically be required in due diligence, and it can be a valuable way for you to demonstrate to potential limited partners that you have fully thought through what it takes to run a fund.
Capital Budgeting
Capital budgeting is the process of determining how much money you can invest. At the simplest level, overall invested capital is typically:
Committed capital - organizational fees - operational fees (fees paid by the fund) - management fees (fees paid to the management company to operate the fund) + recycled management fees (recycled proceeds back into the fund, as a percentage of management fees)
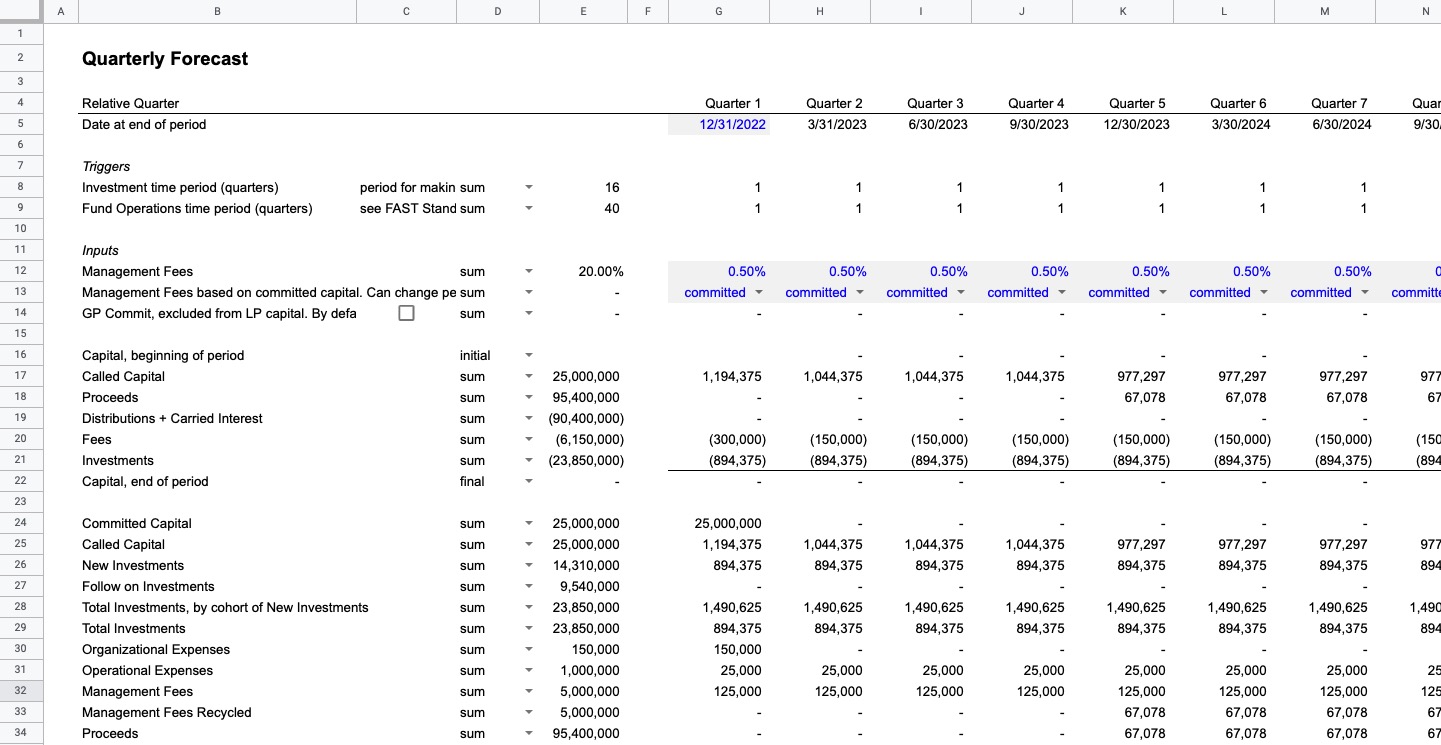
The budget can be created for just the overall amount invested, or can be created to show the budget for multiple periods over time (per year, per quarter, per month) if you are modeling cash flows over time.
The primary driver of your budget for capital to invest is your fund size, or total committed capital. Since management fees are typically a percentage of your committed capital (paid over time with a constant percentage per year, a changing percentage per year, based off called capital, or based off invested capital under management), fund size will directly determine management fees. Organizational fees - typically the legal costs to create the fund, which can often be charged to the fund - and operational fees - fees that are charged to the fund, including annual fund administration expenses, taxes, audit, and fund legal costs - are related to fund size, as the size of the portfolio and scope of investments will impact both of those expenses. Organizational fees are typically a one-time charge to the fund in the first period of operation (perhaps additional periods if the fund holds multiple closes), whereas operational fees are typically charged annually while the fund is operational.
To understand the size of organizational and operational fees, the best method is to talk to other fund managers or talk to the service providers directly for their quotes on expenses for your fund. Many providers - Carta, AngelList, Allocations, Anduin, Assure, and others - provide online pricing estimates.
VC Lab has a good overview on managing fund expenses to understand what should be charged to the fund and the management company, what type of expenses to expect, and some help on how much to budget for fund operational expenses.
Portfolio Construction
Once you’ve created your capital budget and decided on the core timescale necessary for your current needs, the next consideration is how you want to approach portfolio construction. Portfolio construction is the process of creating your portfolio strategy, check sizes, follow on reserves, and expectations around valuations, ownership, and dilution over time. Mechanically, there are four primary ways to model portfolio construction in spreadsheets:
- Average investment approach, overall blended follow on strategy. In this approach, you would assume the average new investment (check size) and the allocation of capital to new investments and follow-on investments, and assume an overall return multiple on invested capital. This is the simplest approach, and works well for initial analysis, if you are not pursuing a follow-on strategy, and if you do not need a lot of detail around your portfolio construction. See my free Excel model for this approach.
- Average investment approach, detailed per-round follow on strategy. In this approach, we use the same assumptions as above, but detail out the capital allocated, check size, and expected participation into each follow-on round of financing. As part of this, we will often detail out the expected future rounds to show how ownership changes over subsequent rounds, show our dilution, and estimate returns and changes in investment value over time. See my Excel model for this approach.
- Specific investment approach, blended follow-on strategy. In this approach, instead of assuming an average investment, we create specific assumptions around each new investment made (check size, timing) and then assume an average allocation of capital to follow-on investments, without detailing the follow-ons specifically. See my free Excel model for this approach.
- Specific investment approach, modeling each specific investment amount, timing, and follow on. In this approach, we build on the specific investment approach for new investments and add in detailing the forecasted follow-on for each investment, assuming whether there is a follow-on, whether we participate in it, valuation, and our exit returns from that investment. The most detailed approach, this approach is also often used for portfolio tracking, to track portfolio performance or budget reserves for follow-ons and return expectations from the portfolio. See my Excel model for this approach.
There is no single right way to approach portfolio construction. The “best” way to forecast a portfolio depends on your specific needs. More detail may sound appealing, but requires more assumptions and may not be necessary for your needs. If this is your first fund and you’re in the early planning stages, start with the first approach. If you have a set of investments you know you are making (or have already made), start with an approach that uses specific investments. If you are thinking about portfolio construction and allocation to follow-ons and what to think through the mechanics of dilution and returns, start with the detailed per-round follow-on approach. Ultimately the question to ask is how you plan on using your model, what decisions you will make with it, and your ability to create, use, and manipulate the important decisions in your model.
Returns Expectations
The methodology to forecast return expectations is often determined by your approach to portfolio construction, but the simplest method is to assume a gross exit multiple for your invested capital.
Gross exit multiple * invested capital = proceeds from investments
Proceeds from investments are then distributed to the investors in the fund, typically defined as the fund’s limited partners. Distributions are capital paid back to the investors, and can vary from proceeds received depending on recycling provisions or other agreements with limited partners. A schedule of distributions is often called a waterfall, which depicts the flow of capital to investors based on the fund’s agreements with it’s investors. Typically limited partners are first paid back the capital they invested, perhaps with a preferred return or after accounting for a hurdle rate of performance, and then general partners start to receive carried interest, or a percentage of the distributions paid based on the performance of the investments.
Fred Wilson has a foundational post on modeling fund economics at Venture Fund Economics, Gross and Net Returns
In many models, a straightforward way to model return economics is to create an input to assume a gross exit multiple, then calculate gross proceeds using that multiple. You can get more detailed by assuming different gross proceeds multiples for different types of investments, different stages (new and follow-on, by stage), or just an overall blended multiple. A typical method to add more detail is to create a table of types of exits - zero, small, medium, large, etc. - and the gross exit multiple per type of exit, and the % of companies that achieve each exit, to calculate an overall blended proceeds multiple that provides more color to the investment strategy.
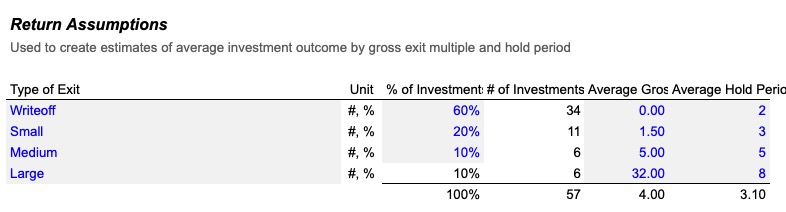
This method abstracts away how the multiple occurs, and does not require one to model the underlying changes in the invested capital post-invested. Meaning, it does not model out ownership, dilution, the impact of additional rounds, time to exit, or the different stages and multiples that exits can occur. If desired, using the more detailed portfolio construction methods to show the rounds of financing that occur post-investment - on an average or specific-company basis - can help detail your expectations of how many companies raise additional capital, how large the rounds are, how much your ownership is diluted, when potential exits can happen, and the different exit points you expect to see in your investments.
Creating an expectation of entry valuation, overall dilution, and average exit can be helpful to ground your gross exit multiple assumption. If worthwhile, creating a more detailed portfolio construction can help show how you expect to earn the gross exit multiple.
Capital Deployment
Capital deployment modeling involves creating a schedule of investments, fees, and capital calls over time. The easiest way to model a fund is to not do this, meaning just model the overall investments and exits without accounting for when they happen, but if you decide that it’s important to create a time-based forecast, then you will have to create a capital deployment schedule.
Most managers will want to start this by assuming an investment timeframe, in terms of quarter or years, post-close of the fund where new investments will be made. Then you can average out the deployment of capital allocated to new investments over this timeframe.
If you are investing in follow-ons, typically you will assume deployment of capital into follow-ons using an assumption of time from initial investment to each follow-on round that is part of your strategy. This will extend outside of your investment timeframe.
With this forecast of invested capital per period (quarters, years), then you can create a forecast of management fees and operational fees per period, to create a schedule of called capital. Many funds will call capital according to investments plus fees per quarter, but some funds will call capital annually, or if the fund is smaller, call a significant portion or all capital up front, upon fund close. Regardless, once you’ve forecasted investments and fees, then you can apply the logic for calling capital, and create a forecast of available fund capital:
Capital Available, beginning of period + called capital - management fees - operational and organizational fees - invested capital = capital available, end of period
Many funds will additionally want to create a forecast of reserves for follow-on capital, based on their schedule of new investments, to show how they are budgeting capital for potential follow-ons. For forecasting a new fund, this isn’t typically too important because your forecast of new and follow-on investments and called capital implicitly assumes this, but once you start tracking actual investments and can apply some logic to different expectations of follow-ons for specific companies, creating a capital reserves forecast can be very important to help for capital deployment budgeting.
Realized Cash Flows
If you are creating a time-based fund model, you will likely want to create a forecast of proceeds and write-offs (when the value of your investments in companies are marked down to zero, likely because the company went out of business). The typical method is to use your earlier assumption of gross exit multiple and an assumption of average hold period, and then calculate when proceeds happen and how large based on your capital deployment schedule.
Proceeds from investments are then either recycled back into new investments or distributed to investors in the fund.
Waterfall Distribution of Proceeds
A waterfall depicts how the proceeds are distributed to the investors and managers of the fund, according to the funds’ provisions.
- In a typical USA-based venture fund, a waterfall just involves modeling the return of capital to the limited partners, then any distributions above that multiplied by the fund’s carry to calculate carried interest. An additional level of detail that can come into play is if the fund is using a tiered carry approach, where the carried interest percentage increases as the fund hits certain return benchmarks as specified in the fund agreements.
- In many non-USA venture funds (and US private equity funds), there are additional structures that can complicate waterfall modeling. Preferred returns - commonly cited as a percentage return on invested capital - or a hurdle rate - a required rate of return on invested capital - serve to provide first returns to limited partners before general partners can share in the distributions, although terms such as a general partner catchup can allow general partners to earn back the carried interested they would have earned on the preferred return, if there are sufficient proceeds.
For an overall portfolio model, this can be fairly simple to model, as you do not need to account for who receives distributions when, but for a time-based model, it gets more complicated as you will need to track the distributions of proceeds against called capital to show the return of capital to limited partners, potentially the distributions to pay for the preferred return and optionally GP catchup, and then the split of distributions between limited partners and the general partners based off the carried interest earned by the general partners on the proceeds.
Unrealized changes in the portfolio
An additional option in building your fund model is whether you want to show the changes in valuation in the underlying portfolio. Residual value is the current market value of the investments, which represents the sum of current invested capital (investments made, less any write-offs) plus unrealized gains from increases in value of the investments. Most funds will mark up their investments based on updated valuations of their companies, particularly when they raise new rounds at different valuations.
Modeling these underlying changes in the portfolio is only necessary if doing a time-based model, since once all investments are exited, residual value is equal to zero. It can be complicated to add this to a model, but is necessary for understanding the value of a portfolio when the fund is still deploying capital or not fully exited. Personally, I think this is valuable to add for any investor managing other people’s money, so that they can provide the level of detail and communication around performance reporting that limited partners should demand.
Mechanically, typically you will have to use a detailed portfolio construction approach to show the expected timing to write-offs, additional funding rounds, and exits to create a schedule of current invested capital and unrealized gains, increasing them when new investments are made or when investments are marked up, and decreasing them when investments are written off or exits occur.
Performance Metrics
Two primary metrics are used to evaluate all types of investments, IRR and return multiples. You will want to create a model to report two variations of these, by gross and net:
Gross multiple = proceeds / invested capital
Net multiple = distributions / paid in capital
The key difference between these is that gross highlights the performance of the investments, net highlights the performance of the fund by including expenses (carried interest, management fees, and other operational and organizational expenses).
You will also want to detail gross and net IRR, and typically the best way to do this is to create one line to show gross cash flows per period, and one for net cash flows per period - using the same definitions for gross and net above - and then use IRR or XIRR functions in spreadsheets to calculate IRR.
If you are creating an overall portfolio model only, calculating multiples will be straightforward, you can estimate IRRs by using the total returns and an expectation of the fund’s lifetime. Using a time-based model will allow you to report IRRs more robustly.
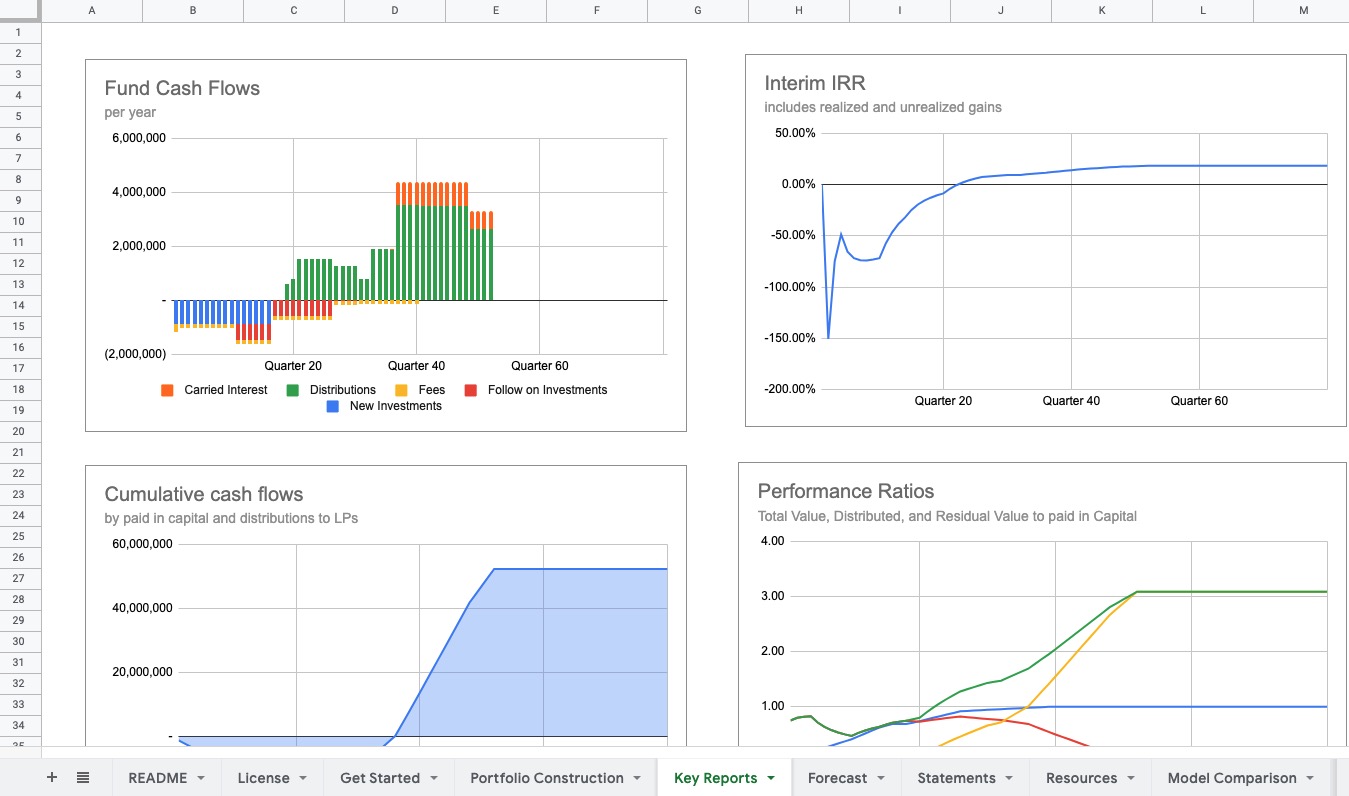
By definition, these metrics only measure realized returns, so they only tell part of the story for a fund that is currently investing and not fully exited from their investments. Interim IRR is an additional metric that allows you to include the unrealized value of your investments in your “proceeds”. Mechanically, this requires building a per-period cohort approach to model out the cash flows and total residual value at the end of each period, and calculate Interim IRR per each forecasted period. Since Interim IRR will equal overall IRR at fund exit, this is only valuable to show the changes in value over time. Typically funds will forecast this to show their expected J curve, to show the negative IRRs early (since you will call capital, and your investments will be less than called capital because there are fees to operate the fund) and then rise over time as investments are marked up and exits occur.
All Foresight models that model cash flows over time include a prebuilt section to model Interim IRR.
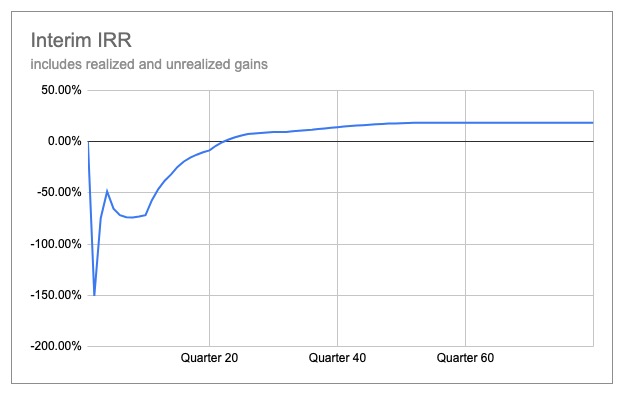
Structurally, I typically model interim IRRs based on paid in capital, but do not include expected carried interest, so Interim IRRs usually rise and then decline over time to overall net IRR as residual values are taken off and distributions net of carried interest occur. More complicated approaches could factor expected carried interest into their calculations.
For a deeper discussion of interim IRRs, I highly encourage you to read Allen Latta’s post on IRRs. He has a number of posts that dive deep into the mechanics of funds that are great resources for fund managers.
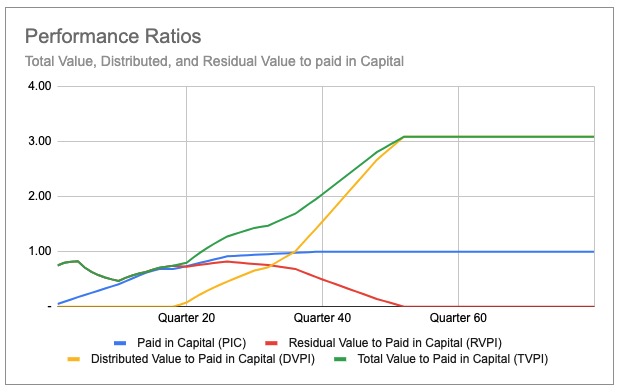
When modeling funds over time, you will also want to include four key performance metrics to aid in benchmarking and quick communication of returns:
- Paid-in Capital, or portion of current cumulative paid-in capital to total committed capital
- Residual Value to Paid in Capital (RVPI), showing current residual value divided by current paid in capital
- Distributed Value to Paid in Capital (DPI), showing current cumulative distributions divided by paid in capital
- Total Value to Paid in Capital (TVPI), showing total value from distributions plus residual value, divided by paid in capital. TVPI = DPI + RVPI
The key to these metrics is that they explain different things about the fund’s performance; RVPI highlights how much value in the fund is in the current investments, and DPI reports how much has been distributed to investors. At fund exit, RVPI = 0 and DPI = TVPI, so if you are creating an overall fund model, these metrics will not be as relevant as the multiple and IRR metrics above, but they can be valuable if creating a time-based fund model.
More on metrics at Metrics for Venture Capital Funds
GP and LP Economics
Many funds will want to show the return metrics separately for GPs and LPs, using the waterfall detailed above to forecast the cash flows to each party. Most fund models at this stage do not detail out the specific returns to each LP, except in cases when limited partners have different investment terms (potentially different carry, management fees, or ownership of a portion of the GP’s carry), which will require more detailed modeling to show the different returns to types of LPs.
Most funds will not detail out the returns to each GP in their fund model, but often managers will want to create a separate sheet or model to show the potential returns to each GP based on their individual general partner commitment and share of the carry.
Management Company Budgeting
So far, we have focused on modeling for the fund, but an additional concern can be in budgeting for the management company operating the fund. This can be valuable to detail the hiring plans and operational strategy for the management operational strategy, and important to show that the cash flows from the management fees can support the management company’s overhead. Modeling this is very similar to budgeting for any operating company, involving a forecast of hires and salaries, insurance, accounting, legal, and overhead costs, and using the fund’s forecast of management fees as the revenues for the management company.
Funds commonly misinterpret what expenses are paid for by the fund and what are paid by the management company. VC Lab has a good explainer at Managing Fund Expenses for Venture Capitalists.
Typically funds will model the management company through the entire fund life, but as the management fees from the fund expire, either (a) assume that they will raise another fund managed by the same management company, showing management fees from the new fund, or (b) show how the management company expenses will decrease over time. Typically this is not an important issue, as most fund managers will strive to raise another fund beyond the immediate one being forecasted, so any shortfall in revenues would be covered by the future fund.
Budgeting the Management Company of a Venture Capital Fund covers modeling a management company in detail. For additional detail on budgeting for Rolling funds, I wrote a post on budgeting for Rolling funds with AngelList.
Special Considerations in Venture Fund Modeling
Some special cases can create specific needs in creating fund models, I’ll cover each in brief but happy to answer additional questions by contacting me.
Revenue-Share Funds
The prior discussion of modeling proceeds assumes that the primary method for earning returns are through exits from the companies. Revenue-sharing funds typically make investments into companies that earn them distributions over time, in advance of exits, as a share in their companies’ revenues. The basic structure for modeling the fund still holds, except you will need to create a schedule of proceeds that aligns with the different timing expectations of revenue-share agreements.
The current suite of Foresight models work for forecasting the investments and all portfolio metrics for funds using revenue-sharing, but are not prebuilt to handle the calculation of proceeds from revenue-sharing over time. Fund managers can create a custom forecast of proceeds from revenue-sharing that can be linked into the core structure with minimal effort. For questions, contact Taylor.
Venture Debt Funds
Similar to revenue-share funds, venture debt funds invest using different investment structures, and tend to have different size and distribution of returns for their investments. The basic structure of the fund model still holds, except you will need to create a debt amortization schedule to show the repayments of principal and interest, as well as the proceeds from any equity share or warrants, will be necessary to model a venture debt fund.
The current suite of Foresight models work for forecasting the investments and all portfolio metrics for funds using venture debt, but are not prebuilt to handle the calculation of repayment of capital over time. Fund managers can create a custom forecast that can be linked into the core structure with minimal effort. For questions, contact Taylor.
Fund of Funds
Fund of funds invest in venture capital funds. While similar to modeling venture funds, typically you will want to create a schedule of new fund commitments to create a forecast of expected capital calls (structurally similar to a forecast of new and follow-on capital, except there are many more “rounds” of capital calls than follow-ons into companies). Typically we model the expected underlying value of the funds to report total fund-of-fund economics in a similar method to fund modeling.
Check out the free Fund of Venture Funds Model.
Crypto Funds
Crypto funds, whether they are structured as traditional funds or DAOs, are typically modeled in much of the same way as other funds. Typically crypto funds will hold more investments that can be marked to market easier, since many tokens will be traded on crypto exchanges, and funds will have more liquidity options, and thus will need robust structures to track token prices, liquidity timings, and track residual and realized value, but the same structure and metrics still apply.
The core Foresight models support crypto investments, often managers will want to customize the proceeds forecasts to capture the often earlier liquidity of these investments, and the typical phased selling of portions of their tokens. Once investing, fund managers will often want to use data tools to automatically pull in crypto asset prices for portfolio tracking purposes. Contact Taylor for any questions.
European v American Waterfall
Most venture funds use a European waterfall, where proceeds are distributed on a total fund basis, instead of an American waterfall, where proceeds are distributed based on a deal-by-deal basis, so for most modelers this will not be an important practical consideration. If you are using an American Waterfall, creating a forecast using a specific forecast of investments is usually helpful to do the calculations per investment to show proceeds and distributions specifically.
For managers investing through a series of Special Purpose Vehicles (SPVs) and modeling the aggregate of those vehicles, the waterfall works a bit differently. The American waterfall is commonly referred to as deal-by-deal, but to be clear, that does not mean that each deal is separate; the fund still has to return on the total called capital for all investments, and mangers can be subject to clawbacks if the aggregate carry paid out in the earlier periods does not pay the full cost basis of later investments that do not return capital. SPVs work differently, and they are true deal-by-deal, meaning one investment does not have to pay back the cost basis of other investments. Each SPV will often have different LPs, and the terms for each deal can be different, so this is a natural occurance.
Important to note that all things being equal in terms of investments and returns, European and American waterfalls will result in the same amount of total carry being paid to the GP - although the timing will be different, the American waterfall will result in earlier carry payments - the SPV approach will resultin higher carry being paid to the GP.
The current suite of Foresight models offer a dropdown select of European Waterfall (total fund to date), American Waterfall (deal by deal, with clawback), or SPVs Waterfall (no clawback). Additional details at Creating and Managing Investment SPVs.
Rolling Funds
AngelList’s Rolling Funds add a special consideration in modeling, since typically the fees are collected differently than traditional funds, and the waterfall is done on a per-period basis since each period (quarter) is a separate fund. For more detail, read How to make a budget for a rolling fund, which I authored with AngelList.
Foresight offers the model built for AngelList for free at Rolling Fund Budgeting template.
General Partner Commit
Some funds will model their waterfall treating the general partner commitment - the investment by the general partners into the fund, commonly called the GP commit - as a limited partner interest, some will not. If the fund treats the GP commit as an LP interest, then it is fairly straightforward to show the economics to GPs and LPs, as the GPs will take distributions using the percentage of the fund size that they invested in (GP commit divided by committed capital) plus their carried interest. If the GP commit is not treated as an LP interest, then the waterfall is amended to show the return of LP capital first, then the split between LPs and GPs using the carried interest percentage, and the GP’s returns do not include a portion attributed to their commit. This is a small assumption that most funds will not need to consider, if necessary it is a checkbox option in most of my models.
Note that management fees are typically not charged on funds invested into the fund via the general partner commitment, so the total management fees charged to the fund commonly will be less than you would expect if you just assumed fees to be a percentage of the total fund size.
All Foresight models are prebuilt to handle treating the GP commit as an LP or interest or not, simply check the box as appropriate and all formulas change automatically.
Management fee recycling
Recycling management fees or recycling proceeds will increase invested capital. If your agreements with your limited partners allow you to recycle early proceeds from investments back into new investments (instead of distributing these proceeds to the investors in the fund) and to pay for fees, then many managers of funds will choose to recycle these proceeds, typically up to the amount of the management fees charged to the fund, in order to boost their fund returns. There is extensive literature on the web about the incentives and reasons to recycle management fees; for capital budgeting purposes, we usually assume a percentage of management fees to be recycled (0 to 100%, or over 100% if managers are more aggressive) and add that back to increase invested capital.
All Foresight models are prebuilt to handle management fee recycling with a couple options on how to use it. More details on recyling are covered at Management Fee Recycling
Management fees based on invested capital
Modeling management fees based on committed or called capital is straightforward, but modeling fees based on invested capital (also called assets under management) takes special structural considerations. Since the fees are typically a percentage of the total invested capital at the end of each period, calculating the fees in spreadsheets creates a natural circular reference that is not easy to manage, and can be complicated for spreadsheets to calculate without more detailed linear optimization approaches. In practice most managers use an iterative approach by varying their assumptions to get total called capital as close to total committed capital as possible, but it can take some attention to manage model updates when using management fees based on invested capital
All Foresight models are prebuilt to handle modeling fees based on committed, called capital, and assets under management, simply select the appropriate option.
Evergreen or Open-ended Funds
Evergreen funds typically recycle a large share of proceeds back into new investments, maintaining a base of capital that is constantly recycled over time. Open-ended funds typically allow investors to redeem invested capital based on agreed timelines, and pay distributions over time. Modeling redemptions and new investors coming creates a couple of issues, and often requires calculating a NAV (net asset value) to use so that new investors are investing at a higher cost basis than earlier investors. With the recent announcement of Sequoia’s change in fund structure, this has created new levels of interest in open-ended funds or permanent capital structures, although it is still not a common structure for emerging managers to use.
LP side letters and varying terms
Some funds will create arrangements where different limited partners get different terms, namely either different fees (management fees or carried interest) or priority placement in the waterfall. Some funds will work with LPs to be first-loss capital, or may get a preferred return prior to other LPs, or they may get a portion of the GP carry. Each special term usually requires specific modeling for each consideration by breaking out the LPs separately, so the effect of each term can be clear.
Modeling multiple funds and SPVs
Often managers will invest through multiple funds, managing their primary fund, an opportunity fund, or special-purpose investment vehicles (SPVs) to make special investments outside of the fund with their limited partners. The best approach is usually to model each of these separately, and then combine into one comprehensive model, to show the cash flows and impact of each strategy separately and as a whole.
All Foresight models can support modeling multiple funds and separate investment vehicles. Users can duplicate the two core sheets creating the fund forecast, then link them into the Forecast sheet to create an aggregated view of the total investment strategy.
Management Fees, Cashless Contributions, and Fee Waivers
Budgeting for managers to pay their GP commit can be an issue for many managers. Managers may fund their commit from their own personal wealth, or pay for their GP commit using their management fees (post-tax), therefore reducing the net profits from the management company.
Management fee waivers are cashless contributions to the fund, where the fund manager chooses to satisfy some of their GP commit by waiving their management fees. The major rationale behind cashless contributions is to satisfy the GP commit without paying ordinary income taxes on the management fees waived to satisfy the commit, but that has significant tax implications and managers should consult experienced tax professionals before using this strategy.
Using your Venture Model
Creating a forecast is easy, making sure it’s believable is hard. Data on fund performance is sparse and difficult to collect, and typically best known by experienced fund managers and limited partners that work across multiple funds. Data can be specific to a certain time period or vintage, and may not be relevant for your strategy, geographical focus, stage, or current market conditions. Even data from known industry data sources CB Insights and Pitchbook can be more directional than statistically significant.
Two data sources that are regularly updated and available:
- Pitchbook – NVCA Venture Monitor. Updated quarterly with data and insights.
- CB Insights State of Venture. Updated quarterly with data and insights.
Scenario Modeling
Creating scenarios is an important way to think about your returns. There are two primary ways to define scenarios:
- Range-based scenarios, to evaluate different inputs and impact on outputs
- Situation-based scenarios, to evaluate different strategies
Range-based scenarios are typically done to show best, base, and worst case scenarios by varying the fund’s overall return multiples. They can be good for analyzing scenarios and discussing options with potential limited partners. Situation-based scenarios are typically better when you are considering how to structure the fund and evaluating different strategies, to show how the numbers reflect different fund strategies.
All Foresight models allow managers to use tools for scenario modeling, including Causal’s scenario modeling add-in for Excel and Google Sheets, Monte Carlo simulation tools, and other Excel and Google Sheets add-in simulation tools. You can also create scenario tables in additional sheets to create your own scenarios based on the inputs you want to evaluate. More at Scenarios.
Tracking Actual Investments
Once you are actually making investments, it can be valuable to create a way to track your investments, create a specific schedule of capital reserves, and track your capital deployment pacing. Are you deploying capital faster or slower than expected? Are follow-ons coming in sooner than expected? Does your original budgeting strategy still hold?
Usually I will create one model for tracking investments, useful to help report investment performance to limited partners and internal team members, and one model for forecast, and then create a model that combines the two to aid in budget variance analysis.
The free model for venture portfolio tracking can provide a good structure to use for tracking investments in an angel or venture portfolio. The more advanced Foresight model combines tracking, forecasting, and variance analysis into a single model.
Strategy drives model, model reflects strategy
Don’t lose sight of the big picture. A model is an analysis tool, and is only as good as the data used to create the assumptions. Be careful using the model for portfolio strategy optimization decisions, as the data for benchmarking venture funds can be difficult to find and use for your specific model.
There are a number of additional resources that you can leverage to learn more. Join Slack groups for experienced or emerging managers, or groups like On Deck Venture Capital or On Deck Angels, of which I am an alum, or join accelerators like VC Lab, First Round Capital’s Angel Track, or Oper8r to get additional assistance in learning how to be an angel or venture capital investor. Learning how venture fund economics work is a valuable educational exercise for prospective angels and general partners, and an important part of demonstrating to potential investors the tactical operational knowledge of how investments generate proceeds and returns. Many emerging managers have learned the basics behind fund modeling on the job, realizing their gaps in knowledge once they had deployed significant capital, but today there are many resources and networks available to people that want to learn venture fund economics. Questions, ask anytime.