The Standard Model and its variants are structured to cover up to 72 months, while the Starter Model, Runway Budgeting Tool, and a few of the forecasting tools are built to cover a time period of up to 36 months.
For early-stage entrepreneurs at an idea or pre-seed funding stage, forecasting beyond three years is incredibly difficult (one year is hard!), and I believe that the goal of doing a five year forecast - to prove the long-term revenue and earnings potential of the business - is better proved by demonstrating the market size and the potential of the business to gain significant traction in that market. For companies with more visibility or understanding of their business model, a market size-based approach to demonstrating the potential of the business is still valuable, but a five year forecast becomes more viable.
How to extend the time period in the models
That said, some investors will request longer projections (common for more mature businesses), or you may simply want to forecast more time periods, so to meet those requests, all Foresight models are open for editing and can be extended to any time period you desire. The process is fairly simple and does not take long, but does require a specific process. Here's how you do it:
- Add in the desired number of additional months in-between the last and second-to-last months in the model by inserting that number of columns on ALL sheets that are built monthly.
Forecastis required for all tools,StatementsandRevenuesare required if they are in your model,Hooks,PricingandFundraisingare required if you are working with a model pre-v5 Standard Model base, and other sheets are optional.For pre-v5 Standard Model bases, you will need to add in the additional number of quarters and years for each of the sheets using the same methodology, between the last quarter and second-to-last quarter, or last year and second-to-last year. For v5 and beyond, it is unnecessary.
- After you've added in all the extra columns, it's time to carry over the formulas. I copy the second-to-last month / quarter/ year and past it over the blank columns, including the last column, and do this on each sheet.
- Next, I have to extend any of the calculations that are based on monthly cohorts. In the Starter model bases, that is only the debt repayment schedule, which is located on the
Forecastsheet. On the principal and interest payment schedules, insert the same desired number of additional months in between the last and second-last months by inserting that number of rows. After I've inserted the rows for both, I copy the formulas down by copying the row of the second-to-last month and pasting it down over the blank rows, including the last month.In the Standard model bases, for any cohort-based revenue forecasts, you will need to also do the same cohort-based adjustments as above for those, either on the
Forecast(pre-v5) orRevenues(v5) sheets. As a note, the cohort buildup in theRevenuessheet is fairly extensive, and is a lot of work to extend all cohorts for extra periods, and I generally discourage doing that edit. - Next, I update the
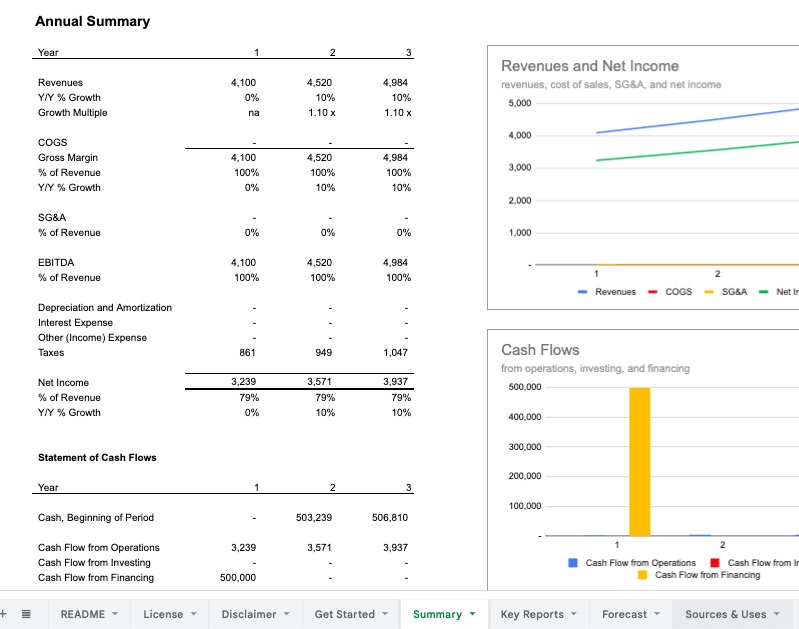
Summaryby adding in the desired number of years, and copying the formulas over using the same method. - The
Key Reportsshould update automatically.For pre-v5, you will need to edit each report so that it covers the desired time period. On these, you need to insert the columns a little differently, by highlighting the appropriate cells that you want to move to the right and shifting them to the right the appropriate number of times for the number of time periods you want to add. If you shift over the last period in the report, and then copy over the formulas from the second-to-last period, then the chart will update automatically and you won't have to edit the source data in each chart.
It's important that you add in the extra columns on all the sheets before you copy over any formulas, or else the formulas will not work correctly as the linking between sheets will not correspond.
As an aside, consider just editing the
Summarysheet to add on annual forecasts for any extra years you want to add. It is often not necessary to build monthly forecasts for years far into the future, and a simpler annual-based forecast method could be sufficient. In that case, only edit theSummarysheet by adding in columns for extra years, and create a forecast using percentage growth rate (for revenues) and percentage margin (for costs, etc.) for each year.
Contact for questions or assistance
All of that should take you less than 15 minutes (as long as you are not updating the revenue build cohorts on the Revenues sheet). Questions, or want me to do it for you, contact me ›