The Revenues sheet is the core revenue model in the Standard Financial Model, prebuilt to be applicable to a wide range of revenue models.
How to use
The prebuilt revenue model lives across two sheets:
Get Startedis where the most important inputs live, and is intended to be the primary place for user interationForecastis where the calculations live, and is intended to be the place for more detailed assumptions and detailed insights into the business
The assumptions, detailed in the video above, can be modified on the Forecast sheet to change and shape the assumptions over time.
How it works
At a high-level, the prebuilt structure models growth of a metric, which then converts into a metric, then models retention (churn) of that metric, and then revenues and billings resulting from that. The prebuilt calculations will change depending on the selection of revenue model (e.g. recurring, ecommerce, marketplace, etc.), and the model allows you to use this to model overall growth and conversion into one or (optionally) two customer bases (e.g. customer personas, subscriber types, contract cycles, or pricing tiers). The Revenues sheet is linked into the Forecast sheet, which then uses the revenues calculations and carries it through the rest of the model, financial statements, summary, charts, and reporting.
Sidenote, my favorite bit on revenues and startups...
... and now that you want to forecast revenues, here's how to.
Revenue model selection and structure setups
The overall model setup, units input, and revenue model selection is detailed in the video below.
Modeling growth
Written documention on this is coming, at the moment consult the video above, which covers how this section works in detail, and read the notes in the model itself for line-by-line instructions.
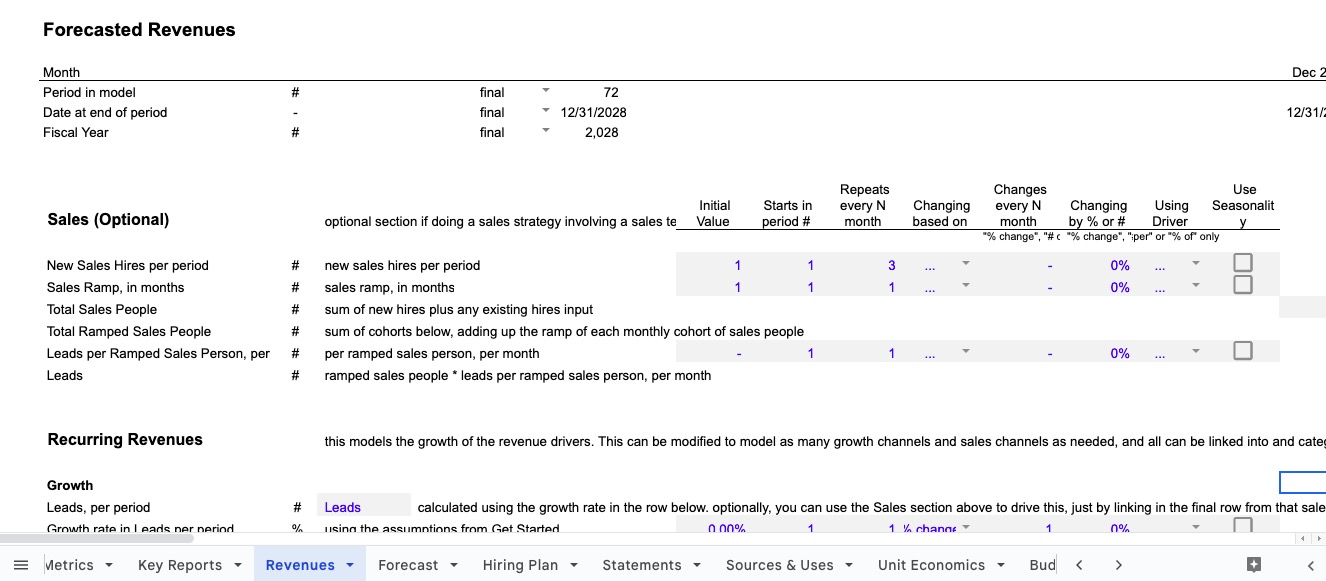
Additionally, you can model growth using the optional sales team section on the Revenues sheet.
Written documention on this is coming, at the moment consult the video above, which covers how this section works in detail, and read the notes in the model itself for line-by-line instructions.
Modeling conversion and retention
Written documention on this is coming, at the moment consult the video above, which covers how this section works in detail, and read the notes in the model itself for line-by-line instructions.
Modeling recurring and transaction revenues
Written documention on this is coming, at the moment consult the video above, which covers how this section works in detail, and read the notes in the model itself for line-by-line instructions.
Linkage to forecast sheet and MRR, ARR reporting
Written documention on this is coming, at the moment consult the video above, which covers how this section works in detail, and read the notes in the model itself for line-by-line instructions.
Inputs
The most important inputs are on the Get Started sheet, and for some inputs there is the potential for additional modifications for rates of change over time on the Forecast sheet. Detailed in videos above.
Common Modifications
The prebuilt revenue model is highly customizable, there are a couple common modifications:
- Adding extra growth channels. By default there are 1 growth channel, which can reflect a mix of total organic and paid acquisitions. Additional growth channels can be added on
Forecast, using whatever custom logic you want to use, and then summed into the total that is used for the conversion calculations. - Adding additional conversion steps. To add additional conversion steps, we just edit the calculations on
Forecast- and often add in the inputs intoGet Started, for a consistent user experience - to capture additional conversions, to whatever level of detail is useful for the business. - Adding additional revenue streams. The model allows you to use the prebuilt drivers in the Revenues section to quickly model any revenues that are based off an operating metric calculated in the revenue model, simply by selecting that metric in the drivers, and then assuming the $ per metric that applies (i.e. # of subscribers from the prebuilt section, and then assume an average monthly revenue for that specific line).
- Adding in custom revenue models. You can also build in any new revenue source based on any business logic you want, simply by pulling your model or sheets into the workbook, and linking the revenues, billings, and optionally the operating metrics into the
Forecastsheet in the top Forecast section.
Questions, support, or customization help, contact me.