The forecasting drivers are easy ways to create dynamic forecasts by simply selecting the appropriate driver and prebuilt rate of change, the start date, and the start amount, and the model will automatically create a dynamic forecast of the metric tied to that driver. This structure is prebuilt into all relevant growth, revenue, and expense lines on Forecast, and can easily be adapted and modified for your specific desired forecasting needs.
Here's an example of what that means. It's common to build a forecast by assuming a 10% growth rate over all periods. We create a line for a metric, say "revenues", and then assume a growth rate, and that creates a forecast of revenues. But in the real world, that method creates problems pretty quickly. A rate of growth rarely stays the same, or to be more specific, it rarely stays at the same average over a long period of time. Your growth in new app downloads may go up slowly, then really fast, then go down over time. Churn may decrease over time as cohorts age. Examples from real life abound.
Seasonality is applied a bit differently; the forecasting drivers create rates of change over time, while seasonality adjusts for seasonal or specific calendar month variations by redistributing a year's rate of change over the time period.
In addition, many costs or revenues may be intrinsically derived from an operating metric. Revenue per user, cost of sales per order, customer support staff needed as the number of clients increase, marketing costs may increase in total as new customer acquisition increase, but decrease or increase on the basis of a per new user; all of those are easy to create through the drivers so that you do not have to custom build in changing rates of change, but instead, can use a dropdown selection to select the desired driver, the start date, and the starting amount.
How to use
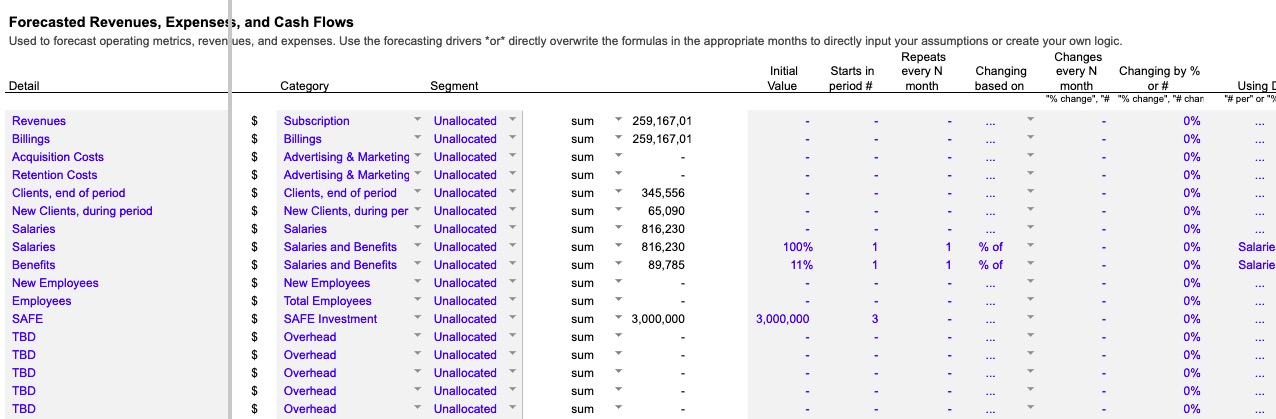
The core revenue/expense lines on the Forecast sheet contain eight columns of inputs - detailed below - and prebuilt formulas in the months use the inputs in those rows to create the appropriate calculations.
Inputs
Inputs for the drivers are in the columns in every calculation revenue/expense row. Here's an explanation for what they mean and how they behave:
- Initial Value. The initial expense, revenue, etc. to put in the first period. If
Changing based onis selected for% of,# per, then this is where you input the % or # to use with the driver selected inUsing Driver; otherwise, it simply sets the initial starting amount for each row's calculations. - Starts in period #. This sets the period (month, quarter, or year, depending on whether you selected the monthly, quarterly, or annual timescaleon
Get Started, respectively) that the initial value should start in. - Repeats every N month. This sets the cadence for repeating the initial or calculated value in future periods. e.g. "1" will be every month, "6" will be every 6 months from the first period. This is commonly used to set repeating revenues or expenses on a calendar-based cycle.
- Changing based on. The options are
% change,# change,log change,% of,# per. These determine which of the next columns of inputs are used. - Changes every N month. Similar idea as
Repeats every month, but this calculates when it changed, based on theChanging based onselection. A common example here is something that repeats every month, but changes every 12 months, like a salary; the combination of these inputs allow you to easily set those cadences. - Changing by % or #. If
Changing based onis selected for% change,# change,log change, then this is where you input how much the change is, as a %, #, or %, respectively. - Using Driver. If
Changing based onis selected for% of,# per, then this is where you input the driver used. You will selections populated from the revenue and expense categories and operating metrics tracked in the model. Common use is to input a cost as a % of revenue, or the cost or revenue per subscriber, for example. - For a max of N months. This sets the max number of months this value should be calculated for. This works by taking the
Starts in period #number and adding this input, and testing against the current period. An example for this would be an expense that last for 12 months after it starts. - To a max value of. This sets the max calculated value in a period, so that it will use all of the other calculations but max out at this value, and then continue at this value for every period in the future unless a max number of months is reached or the timescale flag is used to turn off the number.
- Per-Row Data Flags. This column is used to hold specific calculations in some rows, related to row-specific inputs or calculations.
- Use Seasonality. Checkbox (Google Sheets) or TRUE/FALSE (Microsoft Excel), allows you to turn on seasonality adjustments. If checked or TRUE, the model will use the seasonality assumptions on
Get Startedto adjust the calculations directly in the rows. The goal of the calculations is for seasonality to only impact when things happen, not how much; it shouldn't increase the total, but rebalance when they happen. - Use Event Flag. Placeholder for a custom flag that can be set globally, and then selected whether it is used on a per-row basis. A usecase for this includes setting changes in revenues, expenses, fundraising, or other calculations to specific events.
- Use Custom Flag. Placeholder for a custom flag that can be set globally, and then selected whether it is used on a per-row basis.
- Use Escalation Factor. Placeholder for an escalation / deceleration / inflation factor that can be set globally, then selected on a per-row basis. This could include setting an inflation rate to be applied to expenses or revenues.
- On the
Hiring Plansheet, the drivers have one additional column calledAnnual or Monthly Inputsthat lets you set whether theInitial Valueis an annual number (e.g. total annual salary) or a monthly number (e.g. monthly wages).
In addition to the inputs above, the model has a Timeline Flag, which is used to test to see if the current period is within the period limit set on Get Started. This is applied globally to all root calculations by default, while the flags above are set globally, but selected whether to apply or not per row. The rationale is that the Timeline Flag is meant to turn everything off past the number of periods desired to model, while the other flags relate the events or timing that apply on a row-by-row basis, but can apply to enough rows to warrant building it into the base.
For a max of N months,To a max value of,Use Event Flag,Use Custom Flag,Use Escalation Factorare new in Standard Model v5.3, and the video above will be updated to detail those drivers.
Common Modifications
Modifying the drivers is not common or generally recommended; it's usually easier simply to overwrite the driver formulas with your own custom calculations or logic, or simply type your inputs directly into the relevant months, and not use the drivers.
Questions, contact me.