The Summary sheet is constructed to be the first place to visit to review the model. The goal of the sheet is to quickly communicate the key insights about the business to the intended audience of the model. Therefore, the sheet should be treated as a starting point for you to highlight aspects of the model that are relevant for your use of the model, and you should add lines to the summary income statement and cash flows to fit your needs.
I always look at the Summary sheet first when I am reviewing a model, and I start by looking at the slope of the revenue forecast - to get a sense of scale, then look at the margins (COGS, Gross Margin, SG&A) to see how they are changing as a % of revenue, trying to understand if the changes in costs makes sense given the business type. Then I look at Net Income to get an understanding of how they are thinking about profitability and scale, and to understand if that makes sense given the funding they are looking for, if that's a part of the growth strategy. Then I look at the summary of cash flows to see if the ending cash flows each year makes sense, and at the components of cash flow to get a quick look at the financing strategy (cash flows from financing) and scale of investing back into the business (cash flows from investing).
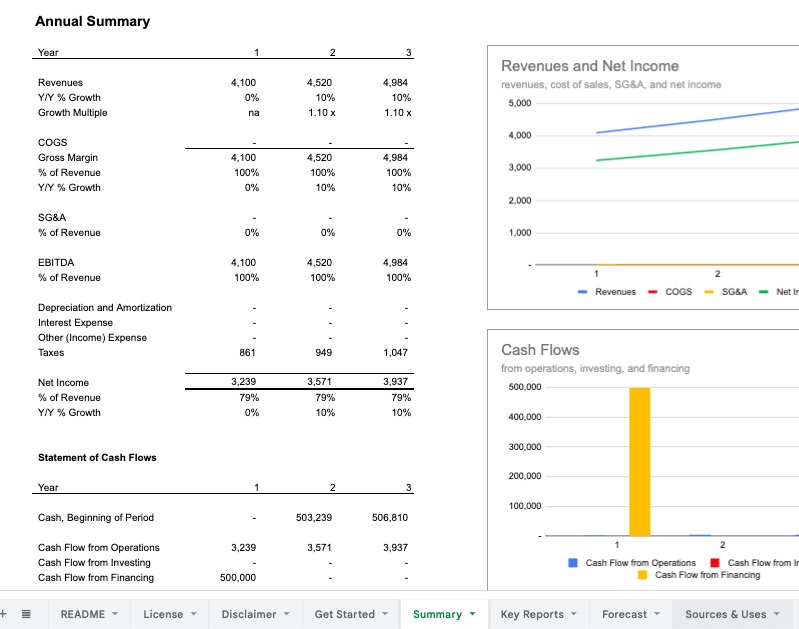
The Summary sheet includes a summarized annual income statement and statement of cash flows and two key visual charts to help explain the two summarized statements. Additonally, sparklines (Excel and Google Sheets) provide quick visual information on the trends of each metric in the summary.
Currently a feature in the Standard Financial Model, Starter Finacial Model, and Runway Budgeting Tool.
Inputs
No inputs are contained on this sheet.
Common Modifications
Any information can be added to this sheet just by inserting rows and linking to the relevant metric calculated in the model. There are a few common modifications to this sheet:
- Adding a prior year to the income statement. The model reports five years of operations, starting with the
model start datein the model (input onGet Startedsheet, details →. If you are looking to report a full-year for the first year for a forecast that starts mid-year, the best way to do that is to input the first date of the fiscal year as themodel start date- i.e., Jan 1, 2023 - then pull in the current year actual results into theActualssection on theForecastsheet. To add in a year to the annual summary that is prior to the current year, I usually do not use themodel start datefor that, but just pull in the prior year's actual financials to a new sheet in the model, as a historical reference, then add a column to the Summary sheet to add in that prior year, and link to that historical information. - Adding more detail to Revenues, COGS, or SG&A. If you have multiple revenue streams, customer sets, or business lines, often you will want to detail those on the
Summarysheet to highlight composition and changes over time. That is easy to add by inserting rows where applicable on the sheet and linking to the relevant information on theForecastorHookssheets. The SG&A expense segments, or COGS components can also be added here if they are valuable to add to tell the key insights about your business - Adding operational metrics. Often people will want to add in additional operational context, for example "New Customers", or "Subscribers, end of period", or "CAC", "LTV", etc. Those metrics are usually contained or calculated in the key financial metrics section on the
Hookssheet, and can be surfaced on theSummarysheet by inserting a row and linking to the annual metrics you want to highlight here.